Iklan

Iklan

Pertanyaan

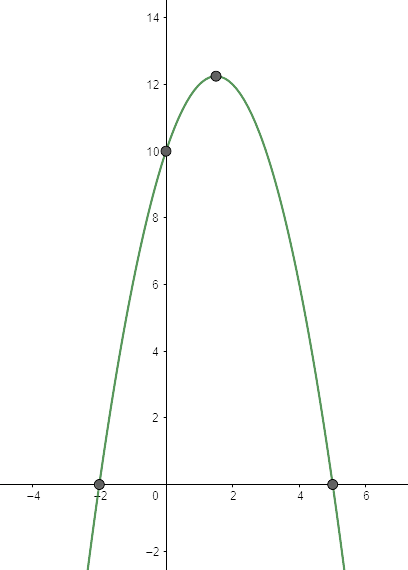
Grafik dari fungsi kuadrat y = − x 2 + 3 x + 10 adalah ...

Grafik dari fungsi kuadrat  adalah ...

Iklan

M. Iqbal

Master Teacher

Mahasiswa/Alumni Universitas Negeri Semarang

Jawaban terverifikasi

Jawaban

dapat disimpulkan bahwa grafik yang terbentuk dari fungsi kuadrat seperti gambar di atas.

dapat disimpulkan bahwa grafik yang terbentuk dari fungsi kuadrat y equals negative x squared plus 3 x plus 10 seperti gambar di atas.

Iklan

Pembahasan

Diketahui : Suatu fungsi kuadrat yaitu Ditanya : Grafik dari fungsi kuadrat tersebut? Jawab: Ingat untuk menentukan grafik fungsi dari suatu fungsi kuadrat ada beberapa langkah yaitu sebagai berikut. Menentukan titik potong terhadap sumbu , Didapatkan titik potong Menentukan titik potong , Didapatkan titik potong dan Menentukan sumbu simetri dan titik puncak grafik tersebut Didapatkan titik nya yaitu Dari titik-titik yang sudah ditentukan maka dapat dibuat sebuah grafik sebagai berikut. Jadi, dapat disimpulkan bahwa grafik yang terbentuk dari fungsi kuadrat seperti gambar di atas.

Diketahui : Suatu fungsi kuadrat yaitu y equals negative x squared plus 3 x plus 10

Ditanya : Grafik dari fungsi kuadrat tersebut?

Jawab:

Ingat untuk menentukan grafik fungsi dari suatu fungsi kuadrat ada beberapa langkah yaitu sebagai berikut.

Menentukan titik potong terhadap sumbu Yx equals 0

table attributes columnalign right center left columnspacing 0px end attributes row y equals cell negative x squared plus 3 x plus 10 end cell row blank equals cell negative open parentheses 0 close parentheses squared plus 3 left parenthesis 0 right parenthesis plus 10 end cell row blank equals cell negative 0 plus 0 plus 10 end cell row blank equals 10 end table

Didapatkan titik potong left parenthesis 0 , 10 right parenthesis

Menentukan titik potong Xy equals 0

table attributes columnalign right center left columnspacing 0px end attributes row y equals cell negative x squared plus 3 x plus 10 end cell row 0 equals cell negative x squared plus 3 x plus 10 end cell row 0 equals cell left parenthesis negative x plus 5 right parenthesis left parenthesis x plus 2 right parenthesis end cell row cell negative x plus 5 end cell equals cell 0 blank atau blank x plus 2 equals 0 end cell row cell negative x end cell equals cell negative 5 blank atau blank x equals negative 2 end cell row x equals cell 5 blank atau blank x equals negative 2 end cell end table

Didapatkan titik potong left parenthesis 5 , 0 right parenthesis dan left parenthesis negative 2 , 0 right parenthesis

Menentukan sumbu simetri dan titik puncak grafik tersebut

table attributes columnalign right center left columnspacing 0px end attributes row x equals cell negative fraction numerator b over denominator 2 a end fraction end cell row blank equals cell negative fraction numerator 3 over denominator 2 cross times negative 1 end fraction end cell row blank equals cell negative fraction numerator 3 over denominator negative 2 end fraction end cell row blank equals cell 3 over 2 end cell end table

table attributes columnalign right center left columnspacing 0px end attributes row y equals cell negative x squared plus 3 x plus 10 end cell row blank equals cell negative open parentheses 3 over 2 close parentheses squared plus 3 open parentheses 3 over 2 close parentheses plus 10 end cell row blank equals cell negative 9 over 4 plus 9 over 2 plus 10 end cell row blank equals cell negative 9 over 4 plus 18 over 4 plus 40 over 4 end cell row blank equals cell 49 over 4 end cell row blank equals cell 12 1 fourth end cell end table

Didapatkan titik nya yaitu left parenthesis 3 over 2 comma 12 1 fourth right parenthesis

Dari titik-titik yang sudah ditentukan maka dapat dibuat sebuah  grafik sebagai berikut.

Jadi, dapat disimpulkan bahwa grafik yang terbentuk dari fungsi kuadrat y equals negative x squared plus 3 x plus 10 seperti gambar di atas.

Perdalam pemahamanmu bersama Master Teacher
di sesi Live Teaching, GRATIS!

8

Iklan

Iklan

Pertanyaan serupa

Diketahui fungsi f ( x ) = − x 2 − 2 x + 15 , tentukan: a. Titik potong sumbu x b. Titik potong sumbu y c. Sumbu simetri d. Nilai maksimum/minimumnya e. Gambarlah grafik fungsi kuadrat ...

11

3.6

Jawaban terverifikasi

RUANGGURU HQ

Jl. Dr. Saharjo No.161, Manggarai Selatan, Tebet, Kota Jakarta Selatan, Daerah Khusus Ibukota Jakarta 12860

Coba GRATIS Aplikasi Roboguru

Coba GRATIS Aplikasi Ruangguru

Download di Google PlayDownload di AppstoreDownload di App Gallery

Produk Ruangguru

Hubungi Kami

Ruangguru WhatsApp

+62 815-7441-0000

Email info@ruangguru.com

[email protected]

Contact 02140008000

02140008000

Ikuti Kami

©2024 Ruangguru. All Rights Reserved PT. Ruang Raya Indonesia