Iklan

Iklan

Pertanyaan

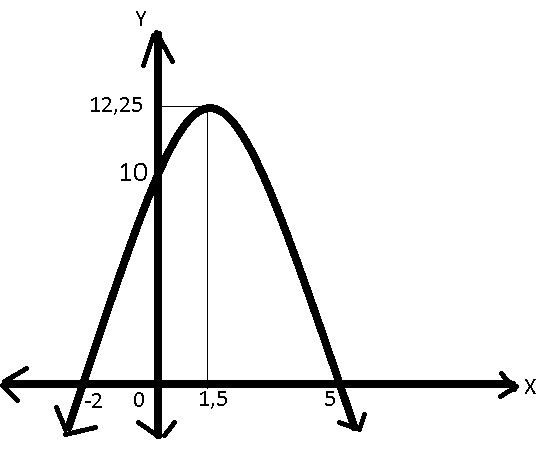
Gambarlah sketsa grafik funsgsi kuadrat berikut! c. f ( x ) = − x 2 + 3 x + 10

Gambarlah sketsa grafik funsgsi kuadrat berikut!

c.  

Iklan

E. Nur

Master Teacher

Mahasiswa/Alumni Institut Teknologi Sepuluh Nopember

Jawaban terverifikasi

Iklan

Pembahasan

Diketahui Titik potong terhadap sumbu- Jadi titik potong sumbu- adalah . Titik potong terhadap sumbu- Jadi titik potong sumbu- adalah . Titik puncak grafik . Titik puncak grafik adalah . Dengan demikian sketsa grafiknya adalah sebagai berikut

Diketahui 

table attributes columnalign right center left columnspacing 0px end attributes row cell f open parentheses x close parentheses end cell equals cell negative x squared plus 3 x plus 10 end cell row a equals cell negative 1 end cell row b equals 3 end table

Titik potong terhadap sumbu-X

table attributes columnalign right center left columnspacing 0px end attributes row cell f open parentheses x close parentheses end cell equals 0 row cell negative x squared plus 3 x plus 10 end cell equals 0 row cell open parentheses negative x minus 2 close parentheses open parentheses x minus 5 close parentheses end cell equals 0 row cell negative x minus 2 end cell equals cell 0 space dan space x minus 5 equals 0 end cell row x equals cell negative 2 space dan space space x equals 5 end cell end table

Jadi titik potong sumbu-X adalah open parentheses negative 2 comma 0 close parentheses space dan space open parentheses 5 comma 0 close parentheses.

Titik potong terhadap sumbu-Y

y equals f open parentheses 0 close parentheses equals negative 0 squared plus 3 open parentheses 0 close parentheses plus 10 equals 10

Jadi titik potong sumbu-Y adalah open parentheses 0 comma 10 close parentheses.

Titik puncak grafik open parentheses x subscript p comma y subscript p close parentheses.

table attributes columnalign right center left columnspacing 0px end attributes row cell x subscript p end cell equals cell negative fraction numerator b over denominator 2 a end fraction equals negative fraction numerator 3 over denominator 2 open parentheses negative 1 close parentheses end fraction equals 3 over 2 equals 1 comma 5 end cell row cell y subscript p end cell equals cell negative open parentheses x subscript p close parentheses squared plus 3 x subscript p plus 10 end cell row blank equals cell negative open parentheses 1 comma 5 close parentheses squared plus 3 open parentheses 1 comma 5 close parentheses plus 10 end cell row blank equals cell 12 comma 25 end cell end table

Titik puncak grafik adalah open parentheses 1 comma 5 space comma space 12 comma 25 close parentheses.

Dengan demikian sketsa grafiknya adalah sebagai berikut


Perdalam pemahamanmu bersama Master Teacher
di sesi Live Teaching, GRATIS!

2

Iklan

Iklan

Pertanyaan serupa

Gambarlah grafik fungsi kuadrat berikut ini. 1. y = 2 x 2 pada domain –3 ≤ x ≤ 3

1

4.0

Jawaban terverifikasi

RUANGGURU HQ

Jl. Dr. Saharjo No.161, Manggarai Selatan, Tebet, Kota Jakarta Selatan, Daerah Khusus Ibukota Jakarta 12860

Coba GRATIS Aplikasi Roboguru

Coba GRATIS Aplikasi Ruangguru

Download di Google PlayDownload di AppstoreDownload di App Gallery

Produk Ruangguru

Hubungi Kami

Ruangguru WhatsApp

+62 815-7441-0000

Email info@ruangguru.com

[email protected]

Contact 02140008000

02140008000

Ikuti Kami

©2024 Ruangguru. All Rights Reserved PT. Ruang Raya Indonesia