Iklan

Iklan

Pertanyaan

Gambarkan sketsa grafik fungsi kuadrat berikut, lalu tentukan daerah hasilnya. a. f ( x ) = 2 x − 2 1 ​ x 2 dengan D f ​ = { x ∣ x ≥ − 2 , x ∈ R } .

Gambarkan sketsa grafik fungsi kuadrat berikut, lalu tentukan daerah hasilnya. 

a.  dengan .

Iklan

D. Entry

Master Teacher

Jawaban terverifikasi

Iklan

Pembahasan

Pembahasan
lock

1) Menentukan koordinat titik potong sumbu X Jadi titik sumbu X adalah Menentukan koordinat titik potong sumbu Y Jadi titik sumbu X adalah . 2) Menentukan koordinat titik balik Jadi, titik balik grafik adalah 3) Menentukan titik ujung grafik Jadi titik ujung grafik adalah . 4) sketsa grafik. (catatan: sebelum menentukan sketsa grafik, bisa menentukan titik bantu terlebih dahulu). 
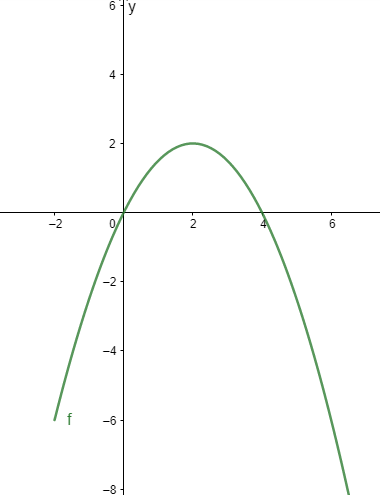
5) Berdasarkan grafik daerah hasil fungsi adalah

1) Menentukan koordinat titik potong sumbu X

begin mathsize 14px style table attributes columnalign right center left columnspacing 0px end attributes row cell f open parentheses x close parentheses end cell equals 0 row cell f open parentheses x close parentheses end cell equals cell 2 x minus 1 half x squared end cell row cell 2 x minus 1 half x squared end cell equals 0 row cell 4 x minus x squared end cell equals blank row cell x open parentheses 4 minus x close parentheses end cell equals 0 row x equals cell 0 space atau space x equals 4 end cell end table end style 

Jadi titik sumbu X adalah begin mathsize 14px style open parentheses 0 comma space 0 close parentheses space dan space open parentheses 4 comma space 0 close parentheses end style 

Menentukan koordinat titik potong sumbu Y

begin mathsize 14px style table attributes columnalign right center left columnspacing 0px end attributes row cell f open parentheses x close parentheses end cell equals cell 2 x minus 1 half x squared end cell row cell f open parentheses 0 close parentheses end cell equals cell 2 open parentheses 0 close parentheses minus 1 half open parentheses 0 close parentheses end cell row cell f open parentheses 0 close parentheses end cell equals 0 end table end style 

Jadi titik sumbu X adalah begin mathsize 14px style open parentheses 0 comma space 0 close parentheses end style.

2) Menentukan koordinat titik balik

begin mathsize 14px style table attributes columnalign right center left columnspacing 0px end attributes row cell X subscript p end cell equals cell negative fraction numerator b over denominator 2 a end fraction equals negative fraction numerator 2 over denominator 2 times open parentheses negative begin display style 1 half end style close parentheses end fraction equals 2 end cell row cell y subscript p end cell equals cell f open parentheses 2 close parentheses equals 2 open parentheses 2 close parentheses minus 1 half open parentheses 2 close parentheses squared equals 2 end cell end table end style 

Jadi, titik balik grafik adalah begin mathsize 14px style open parentheses 2 comma space 2 close parentheses end style

3) Menentukan titik ujung grafik

begin mathsize 14px style table attributes columnalign right center left columnspacing 0px end attributes row x equals cell negative 2 end cell row cell f open parentheses negative 2 close parentheses end cell equals cell 2 x minus 1 half x squared end cell row blank equals cell 2 open parentheses negative 2 close parentheses minus 1 half open parentheses negative 2 close parentheses squared end cell row blank equals cell negative 6 end cell end table end style

Jadi titik ujung grafik adalah begin mathsize 14px style open parentheses negative 2 comma space 6 close parentheses end style.

4) sketsa grafik. (catatan: sebelum menentukan sketsa grafik, bisa menentukan titik bantu terlebih dahulu).


5) Berdasarkan grafik daerah hasil fungsi begin mathsize 14px style straight f open parentheses straight x close parentheses equals 2 straight x minus 1 half straight x squared end style adalah begin mathsize 14px style R subscript f equals open curly brackets y vertical line y less or equal than 2 comma space y element of straight R close curly brackets end style

Perdalam pemahamanmu bersama Master Teacher
di sesi Live Teaching, GRATIS!

4

melda aulia

Makasih ❤️

Iklan

Iklan

Pertanyaan serupa

Diketahui fungsi f : R → R dan f ( x ) = x 2 + 2 x − 3. b . Gambarkan grafik fungsi tersebut.

6

4.8

Jawaban terverifikasi

RUANGGURU HQ

Jl. Dr. Saharjo No.161, Manggarai Selatan, Tebet, Kota Jakarta Selatan, Daerah Khusus Ibukota Jakarta 12860

Coba GRATIS Aplikasi Roboguru

Coba GRATIS Aplikasi Ruangguru

Download di Google PlayDownload di AppstoreDownload di App Gallery

Produk Ruangguru

Hubungi Kami

Ruangguru WhatsApp

+62 815-7441-0000

Email info@ruangguru.com

[email protected]

Contact 02140008000

02140008000

Ikuti Kami

©2024 Ruangguru. All Rights Reserved PT. Ruang Raya Indonesia