Iklan

Iklan

Pertanyaan

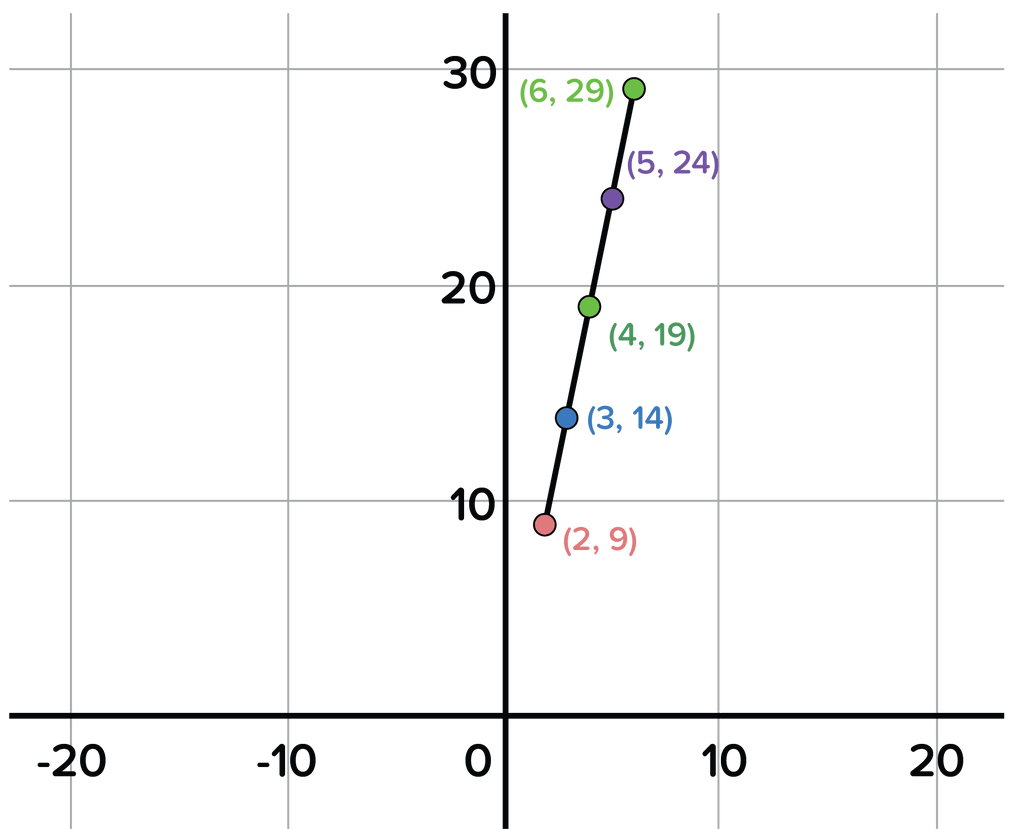
Suatu fungsi linear ditentukan oleh y = 5 x − 1 dengan daerah asal { x ∣ 2 ≤ x ≤ 6 , x ∈ B } . b. Gambarkan grafik fungsi linear tersebut.

Suatu fungsi linear ditentukan oleh dengan daerah asal .

b. Gambarkan grafik fungsi linear tersebut.

Iklan

G. Albiah

Master Teacher

Mahasiswa/Alumni Universitas Galuh Ciamis

Jawaban terverifikasi

Jawaban

gambar grafik fungsi linear digambarkan seperti grafik di atas.

gambar grafik fungsi linear digambarkan seperti grafik di atas.

Iklan

Pembahasan

Dari pertanyaan a di cari daerah hasilnya, Maka di dapatkan titik-titik . Gambar grafik, Jadi, gambar grafik fungsi linear digambarkan seperti grafik di atas.

Dari pertanyaan a di cari daerah hasilnya,

table attributes columnalign right center left columnspacing 0px end attributes row y equals cell 5 x minus 1 end cell row x equals 2 row y equals cell 5 left parenthesis 2 right parenthesis minus 1 end cell row y equals cell 10 minus 1 end cell row y equals 9 row blank blank cell left parenthesis 2 comma 9 right parenthesis end cell row blank blank blank row x equals 3 row y equals cell 5 left parenthesis 3 right parenthesis minus 1 end cell row y equals cell 15 minus 1 end cell row y equals 14 row blank blank cell left parenthesis 3 comma 14 right parenthesis end cell row blank blank blank row x equals 4 row y equals cell 5 left parenthesis 4 right parenthesis minus 1 end cell row y equals cell 20 minus 1 end cell row y equals 19 row blank blank cell left parenthesis 4 comma 19 right parenthesis end cell row blank blank blank row x equals 5 row y equals cell 5 left parenthesis 5 right parenthesis minus 1 end cell row y equals cell 25 minus 1 end cell row y equals 24 row blank blank cell left parenthesis 5 comma 24 right parenthesis end cell row blank blank blank row x equals 6 row y equals cell 5 left parenthesis 6 right parenthesis minus 1 end cell row y equals cell 30 minus 1 end cell row y equals 29 row blank blank cell left parenthesis 6 comma 29 right parenthesis end cell row blank blank blank end table

Maka di dapatkan titik-titik open curly brackets open parentheses 2 comma 9 close parentheses comma open parentheses 3 comma 14 close parentheses comma open parentheses 4 comma 19 close parentheses comma open parentheses 5 comma 24 close parentheses comma open parentheses 6 comma 29 close parentheses close curly brackets

Gambar grafik,


Jadi, gambar grafik fungsi linear digambarkan seperti grafik di atas.

Perdalam pemahamanmu bersama Master Teacher
di sesi Live Teaching, GRATIS!

17

DAFFARUQ BAHTIAR

Mudah dimengerti

Iklan

Iklan

Pertanyaan serupa

Gambarlah grafik fungsilinear dari f ( x ) = x − 6 dengan D f ​ = { x ≤ 7 } . Kemudian tentukanlah daerah hasil dari grafik.

4

4.0

Jawaban terverifikasi

RUANGGURU HQ

Jl. Dr. Saharjo No.161, Manggarai Selatan, Tebet, Kota Jakarta Selatan, Daerah Khusus Ibukota Jakarta 12860

Coba GRATIS Aplikasi Roboguru

Coba GRATIS Aplikasi Ruangguru

Download di Google PlayDownload di AppstoreDownload di App Gallery

Produk Ruangguru

Hubungi Kami

Ruangguru WhatsApp

+62 815-7441-0000

Email info@ruangguru.com

[email protected]

Contact 02140008000

02140008000

Ikuti Kami

©2024 Ruangguru. All Rights Reserved PT. Ruang Raya Indonesia