Iklan

Iklan

Pertanyaan

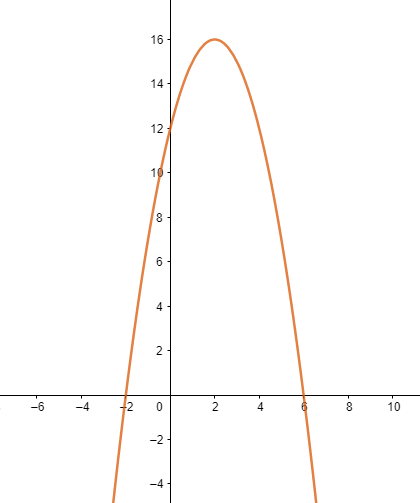
Lukislah grafik untuk masing-masing fungsi kuadrat berikut. c. f ( x ) = − x 2 + 4 x + 12

Lukislah grafik untuk masing-masing fungsi kuadrat berikut.

c.  

  1. ...space 

  2. ...undefined 

Iklan

R. Novianto

Master Teacher

Mahasiswa/Alumni Universitas Tanjungpura Pontianak

Jawaban terverifikasi

Iklan

Pembahasan

Langkah membuat grafik untuk fungsi kuadrat . 1. Menentukan titik potong dengan sumbu , syaratnya . titik potong dengan sumbu berada di 2.Menentukan titik potong dengan sumbu , syaratnya sehingga titik potong dengan sumbu berada di 3.Menentukan koordinat titik balik. koordinat titik balik/titik puncak 4. Menggambarkan kurva pada diagram kartesius dengan menghubungkan titik-titik tersebut dan didapatkan gambar sebagai berikut:

Langkah membuat grafik untuk fungsi kuadrat begin mathsize 14px style f left parenthesis x right parenthesis equals negative x squared plus 4 x plus 12 end style.

1. Menentukan titik potong dengan sumbu begin mathsize 14px style text X end text end style, syaratnya begin mathsize 14px style f open parentheses x close parentheses equals 0 end style .
 

begin mathsize 14px style table attributes columnalign right center left columnspacing 2px end attributes row cell negative x squared plus 4 x plus 12 end cell equals 0 row cell left parenthesis negative x minus 2 right parenthesis left parenthesis x minus 6 right parenthesis end cell equals 0 row cell x equals negative 2 end cell cell text atau end text end cell cell x equals 6 end cell end table end style 


titik potong dengan sumbu begin mathsize 14px style text X end text end style berada di begin mathsize 14px style x equals negative 2 space text atau end text space x equals 6 end style   


2. Menentukan titik potong dengan sumbu begin mathsize 14px style text Y end text end style, syaratnya begin mathsize 14px style x equals 0 end style sehingga begin mathsize 14px style f open parentheses 0 close parentheses equals c end style

begin mathsize 14px style table attributes columnalign right center left columnspacing 2px end attributes row cell f left parenthesis x right parenthesis end cell equals cell negative x squared plus 4 x plus 12 end cell row cell f left parenthesis 0 right parenthesis end cell equals cell open parentheses negative 0 close parentheses squared plus 4 left parenthesis 0 right parenthesis plus 12 end cell row blank equals 12 end table end style 

titik potong dengan sumbu begin mathsize 14px style text Y end text end style berada di begin mathsize 14px style y equals 12 end style 


3. Menentukan koordinat titik balik.

begin mathsize 14px style table attributes columnalign right center left columnspacing 2px end attributes row cell x subscript text puncak end text end subscript end cell equals cell negative fraction numerator b over denominator 2 a end fraction end cell row blank equals cell negative fraction numerator 4 over denominator 2 open parentheses negative 1 close parentheses end fraction end cell row blank equals 2 row blank blank blank row cell y subscript text puncak end text end subscript end cell equals cell fraction numerator D over denominator negative 4 a end fraction end cell row blank equals cell fraction numerator b squared minus 4 a c over denominator negative 4 a end fraction end cell row blank equals cell fraction numerator open parentheses 4 close parentheses squared minus 4 left parenthesis negative 1 right parenthesis open parentheses 12 close parentheses over denominator negative 4 left parenthesis negative 1 right parenthesis end fraction end cell row blank equals cell fraction numerator 16 plus 48 over denominator 4 end fraction end cell row blank equals 16 end table end style 

koordinat titik balik/titik puncak begin mathsize 14px style left parenthesis 2 comma space 16 right parenthesis end style  


4. Menggambarkan kurva pada diagram kartesius dengan menghubungkan titik-titik tersebut dan didapatkan gambar sebagai berikut:


Perdalam pemahamanmu bersama Master Teacher
di sesi Live Teaching, GRATIS!

955

Iklan

Iklan

Pertanyaan serupa

Diketahui fungsi f : R → R dan f ( x ) = x 2 + 2 x − 3. b . Gambarkan grafik fungsi tersebut.

2

4.8

Jawaban terverifikasi

RUANGGURU HQ

Jl. Dr. Saharjo No.161, Manggarai Selatan, Tebet, Kota Jakarta Selatan, Daerah Khusus Ibukota Jakarta 12860

Coba GRATIS Aplikasi Roboguru

Coba GRATIS Aplikasi Ruangguru

Download di Google PlayDownload di AppstoreDownload di App Gallery

Produk Ruangguru

Hubungi Kami

Ruangguru WhatsApp

+62 815-7441-0000

Email info@ruangguru.com

[email protected]

Contact 02140008000

02140008000

Ikuti Kami

©2024 Ruangguru. All Rights Reserved PT. Ruang Raya Indonesia