Iklan
Pertanyaan
What can you summarize from the bar chart above?
What can you summarize from the bar chart above?
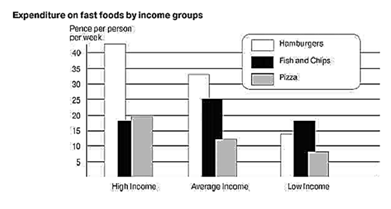
The bar chart above exhibited the amount of money per week spent on three breeds of fast foods such as beef burger, fish and chips, and pizza based on the people income.
The bar chart above disguised the amount of money per week spent on three breeds of fast foods such as hamburger, instant noodle, and pizza based on the people outcome.
The bar chart above disguised the amount of money per week spent on three kinds of fast foods such as beefburger, fish, and pizza based on the people income.
Hamburgers reach less than forty pence a week consumed by high-income group, which is the highest among the expenditure of all three fast foods.
The lowest expenditure of all three fast foods is pizza consumed by high-income group with less than ten pence a week.


Iklan
Y. Yuli.Widya
Master Teacher
Pembahasan
Bar chart membahas tentang jumlah uang dihabiskan dalam seminggu untuk membeli tiga macam fast food, diantaranya adalah burger, fish and chips, dan pizza. Pilihan jawaban yang benar adalah A. The bar chart above exhibited the amount of money per week spent on three breeds of fast foods such as beef burger, fish and chips, and pizza based on the people income karena sesuai dengan informasi pada bar chart diatas, meskipun kata “hamburger” pada bar chart diganti dengan “beef burger” dimana maknanya tetap relavan.
Bar chart membahas tentang jumlah uang dihabiskan dalam seminggu untuk membeli tiga macam fast food, diantaranya adalah burger, fish and chips, dan pizza. Pilihan jawaban yang benar adalah A. The bar chart above exhibited the amount of money per week spent on three breeds of fast foods such as beef burger, fish and chips, and pizza based on the people income karena sesuai dengan informasi pada bar chart diatas, meskipun kata “hamburger” pada bar chart diganti dengan “beef burger” dimana maknanya tetap relavan.


Perdalam pemahamanmu bersama Master Teacher
di sesi Live Teaching, GRATIS!
2
0.0 (0 rating)
Iklan

Pertanyaan serupa
RUANGGURU HQ
Jl. Dr. Saharjo No.161, Manggarai Selatan, Tebet, Kota Jakarta Selatan, Daerah Khusus Ibukota Jakarta 12860
Coba GRATIS Aplikasi Roboguru

Coba GRATIS Aplikasi Ruangguru


Produk Ruangguru
Bantuan & Panduan
Hubungi Kami

Ikuti Kami


©2026 Ruangguru. All Rights Reserved PT. Ruang Raya Indonesia