Iklan
Pertanyaan
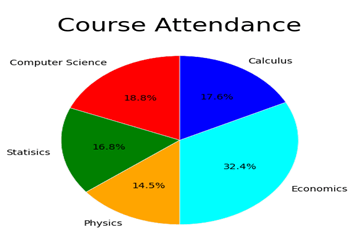
What is the proper order from the highest to the lowest of the pie chart above?
What is the proper order from the highest to the lowest of the pie chart above?
Computer science with 18,8% is placed in the first position of the amount of course attendance, meanwhile statistics with 16,8% in the fourth position, physics with 32,4% in the fifth position, calculus with 17,6% in the second position, and economics with 14,5% in the third position.
Computer science with 18,8% is placed in the first position of the amount of course attendance, meanwhile statistics with 16,8% in the fourth position, physics with 32,4% in the third position, calculus with 16,8% in the fourth position, and economics with 14,5% in the second position.
Computer science with 14,5% is placed in the fifth position of the amount of course attendance, meanwhile statistics with 18,8% in the fourth position, physics with 32,4% in the third position, calculus with 17,6% in the second position, and economics with 16,8% in the first position.
Physics with 14,5% is placed in the fifth position of the amount of course attendance, meanwhile statistics with 16,8% in the fourth position, computer science with 18,8% in the second position, calculus with 17,6% in the third position, and economics with 32,4% in the first position.
Physics with 14,5% is placed in the fourth position of the amount of course attendance, meanwhile statistics with 16,8% in the fifth position, computer science with 18,8% in the second position, calculus with 17,6% in the third position, and economics with 32,4% in the first position.


Iklan
Y. Yuli.Widya
Master Teacher
Pembahasan
Berdasarkan diagram pie diatas, diketahui bahwa economy ada di urutan pertama, computer science di urutan kedua, calculus di urutan ketiga, statistics di urutan keempat, dan physics di urutan terakhir. Pilihan jawaban yang benar sesuai data pada diagram pie adalah D. Physics with 14,5% is placed in the fifth position of the amount of course attendance, meanwhile statistics with 16,8% in the fourth position, computer science with 18,8% in the second position, calculus with 17,6% in the third position, and economics with 32,4% in the first position. Meskipun penulisannya tidak runtut, tetapi datanya relavan.
Berdasarkan diagram pie diatas, diketahui bahwa economy ada di urutan pertama, computer science di urutan kedua, calculus di urutan ketiga, statistics di urutan keempat, dan physics di urutan terakhir. Pilihan jawaban yang benar sesuai data pada diagram pie adalah D. Physics with 14,5% is placed in the fifth position of the amount of course attendance, meanwhile statistics with 16,8% in the fourth position, computer science with 18,8% in the second position, calculus with 17,6% in the third position, and economics with 32,4% in the first position. Meskipun penulisannya tidak runtut, tetapi datanya relavan.


Perdalam pemahamanmu bersama Master Teacher
di sesi Live Teaching, GRATIS!
2
0.0 (0 rating)
Iklan

Pertanyaan serupa
RUANGGURU HQ
Jl. Dr. Saharjo No.161, Manggarai Selatan, Tebet, Kota Jakarta Selatan, Daerah Khusus Ibukota Jakarta 12860
Coba GRATIS Aplikasi Roboguru

Coba GRATIS Aplikasi Ruangguru


Produk Ruangguru
Bantuan & Panduan
Hubungi Kami

Ikuti Kami


©2026 Ruangguru. All Rights Reserved PT. Ruang Raya Indonesia