Iklan
Pertanyaan
This graph for question number 4 - 6 What can be compared according to the line chart above?
This graph for question number 4 - 6
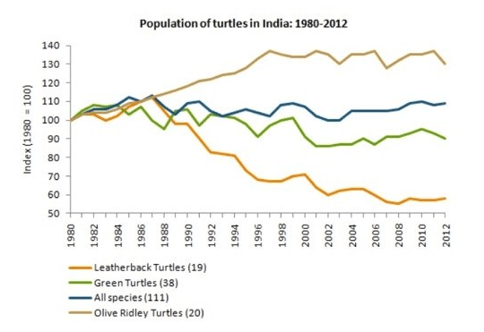
What can be compared according to the line chart above?
The population of Olive Ridley Turtles shows the highest total amount of all sea turtles.
The population of Green Turtles shows similar profile to that of All Species.
The population of Leatherback Turtles is slightly lower than that of Green Turtles in 2000.
Between 1982 and 1992, the population of Green Turtles shows more promising increase than that of Olive Ridley Turtles.
For thirty two years, the population of Green Turtles shows the biggest drop of all sea turtles.


Iklan
Y. Yuli.Widya
Master Teacher
Pembahasan
Dari grafik di atas, dapat diketahui bahwa jumlah populasi penyu Olive Ridley adalah yang tertinggi dan peningkatannya paling signifikan dibandingkan dengan spesies penyu lainnya; Dari keempat jenis, tak satu pun menunjukkan penurunan dan peningkatan jumlah yang serupa; dan populasi penyu Leatherback jauh tertinggal dan menunjukkan jumlah terrendah dibandingkan spesies lainnya.
Dari grafik di atas, dapat diketahui bahwa jumlah populasi penyu Olive Ridley adalah yang tertinggi dan peningkatannya paling signifikan dibandingkan dengan spesies penyu lainnya; Dari keempat jenis, tak satu pun menunjukkan penurunan dan peningkatan jumlah yang serupa; dan populasi penyu Leatherback jauh tertinggal dan menunjukkan jumlah terrendah dibandingkan spesies lainnya.


Perdalam pemahamanmu bersama Master Teacher
di sesi Live Teaching, GRATIS!
1
0.0 (0 rating)
Iklan

Pertanyaan serupa
RUANGGURU HQ
Jl. Dr. Saharjo No.161, Manggarai Selatan, Tebet, Kota Jakarta Selatan, Daerah Khusus Ibukota Jakarta 12860
Coba GRATIS Aplikasi Roboguru

Coba GRATIS Aplikasi Ruangguru


Produk Ruangguru
Bantuan & Panduan
Hubungi Kami

Ikuti Kami


©2026 Ruangguru. All Rights Reserved PT. Ruang Raya Indonesia