Iklan
Pertanyaan
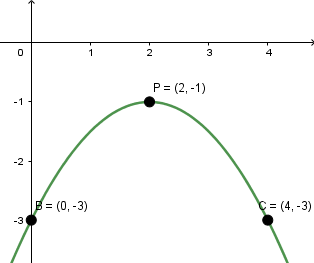
Gambarkan sketsa grafik fungsi di bawah ini. a. f ( x ) = − 2 1 x 2 + 2 x − 3 dengan D f = { x ∣ x < 6 , x ∈ R }
Gambarkan sketsa grafik fungsi di bawah ini.
a. dengan


Iklan
R. Bella
Master Teacher
Mahasiswa/Alumni UIN Syarif Hidayatullah Jakarta
Pembahasan
Diketahui fungsi dengan daerah asal , sehingga diperoleh . Untuk menggambar grafik fungsi tersebut terlebih dahulu ditentukan titik puncak grafik sebagai berikut. Selanjutnya, dengan menguji/mensubstitusi beberapa nilai pada fungsi, diperoleh titik-titik koordinat berikut. Selanjutnya, perhatikan bahwafungsi tersebut merupakan fungsi kuadrat sehingga grafiknya akan berbentuk parabola. Karena nilai maka kurva/ grafik fungsi tersebut akan terbuka ke bawah. Selain itu, nilai diskriminannya dapat ditentukan sebagai berikut. Karena diskriminannya kurang dari 0, maka grafik tersebut tidak akan memotong atau menyinggung sumbu X. Dengan demikian, berdasarkan berbagai informasi di atas, dapat digambarkan grafik fungsi tersebut sebagai berikut.
Diketahui fungsi  dengan daerah asal
  , sehingga diperoleh
 .
.
Untuk menggambar grafik fungsi tersebut terlebih dahulu ditentukan titik puncak grafik sebagai berikut.

Selanjutnya, dengan menguji/mensubstitusi beberapa nilai  pada fungsi, diperoleh titik-titik koordinat berikut.

Selanjutnya, perhatikan bahwa fungsi tersebut merupakan fungsi kuadrat sehingga grafiknya akan berbentuk parabola. Karena nilai  maka kurva/ grafik fungsi tersebut akan terbuka ke bawah. Selain itu, nilai diskriminannya dapat ditentukan sebagai berikut.

Karena diskriminannya kurang dari 0, maka grafik tersebut tidak akan memotong atau menyinggung sumbu X. Dengan demikian, berdasarkan berbagai informasi di atas, dapat digambarkan grafik fungsi tersebut sebagai berikut.


Perdalam pemahamanmu bersama Master Teacher
di sesi Live Teaching, GRATIS!
1
5.0 (2 rating)
Iklan

Pertanyaan serupa
RUANGGURU HQ
Jl. Dr. Saharjo No.161, Manggarai Selatan, Tebet, Kota Jakarta Selatan, Daerah Khusus Ibukota Jakarta 12860
Coba GRATIS Aplikasi Roboguru

Coba GRATIS Aplikasi Ruangguru


Produk Ruangguru
Bantuan & Panduan
Hubungi Kami

Ikuti Kami


©2026 Ruangguru. All Rights Reserved PT. Ruang Raya Indonesia