Iklan
Pertanyaan
Look at the line chart below and answer the question! A brief explanation that best describes the chart is ...
Look at the line chart below and answer the question!
A brief explanation that best describes the chart is ...
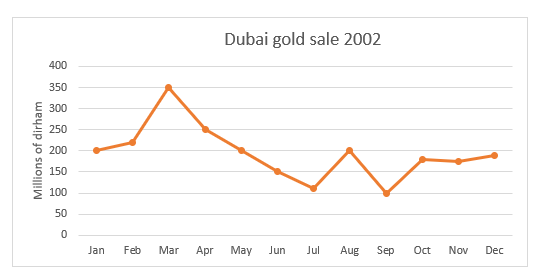
The line chart shows that the highest amount of sales was done in March with 350 million, while the lowest sales were in July and September with only around 110 million Dirham.

According to the given illustration, the gold sale in Dubai was 200 million Dirham in January in the given year and it increased to around 230 million Dirham in the following month.
The given line chart shows the data on gold sales in Dubai from January to December in 2002. As is presented in the illustration, the highest amount of sales were reached in March with 350 million Dirham, while the lowest sales were in July and September with only around 110 million Dirham.
The highest sale of the gold was in March amounting 350 million. From April to July, the sales amount kept on decreasing and reached to the lowest level in July with just above 100 million Dirham. In August the sale was just above 200 million and after that sales amount of Dubai gold showed some fluctuations. In September the sales amount again reached the lowest point.
The chart provides the information on total sales of gold in Dubai, which was 200 million Dirhams in January 2002 and this amount rapidly increased in the next two months. In March, the sales were 350 million Dirhams, the highest in the year, but afterwards, the sales amount steadily declined till July when the gold sale was just over 110 million Dirhams.


Iklan
A. Kencana
Master Teacher
Pembahasan
Soal menanyakan deskripsi singkat yang paling sesuai dengan gambar. Pilihan A tidak menjelaskan informasi umum pada grafik tersebut. Pilihan B hanya menjelaskan penjualan emas di bulan January dan February. Pilihan D menjelaskan informasi umum pada grafik tersebut dan langsung membahaspenjualan pada bulan Maret – September. Pilihan E juga tidak menyebutkan secara jelas tentang informasi umum pada grafik tersebut dan langsung membahas tentang total penjualan di bulan Januari. Jadi, jawaban yang tepat adalah C. Pada pilihan ini dijelaskan bahwa grafik tersebut memuat data-data tentang penjualan emas di Dubai dari bulan Januari hingga Desember tahun 2002. Penjualan tertinggi terjadi pada bulan maret dengan total 350 juta Dirham, sedangkan jumlah penjualan terendah terjadi pada bulan Juli dan September dengan total 110 juta Dirham saja. Informasi yang dimuat pada pilihan C adalah infromasi pokok dari grafik tersebut.
Soal menanyakan deskripsi singkat yang paling sesuai dengan gambar.
Pilihan A tidak menjelaskan informasi umum pada grafik tersebut. Pilihan B hanya menjelaskan penjualan emas di bulan January dan February.
Pilihan D menjelaskan informasi umum pada grafik tersebut dan langsung membahas penjualan pada bulan Maret – September. Pilihan E juga tidak menyebutkan secara jelas tentang informasi umum pada grafik tersebut dan langsung membahas tentang total penjualan di bulan Januari.
Jadi, jawaban yang tepat adalah C.
Pada pilihan ini dijelaskan bahwa grafik tersebut memuat data-data tentang penjualan emas di Dubai dari bulan Januari hingga Desember tahun 2002. Penjualan tertinggi terjadi pada bulan maret dengan total 350 juta Dirham, sedangkan jumlah penjualan terendah terjadi pada bulan Juli dan September dengan total 110 juta Dirham saja.
Informasi yang dimuat pada pilihan C adalah infromasi pokok dari grafik tersebut.


Perdalam pemahamanmu bersama Master Teacher
di sesi Live Teaching, GRATIS!
1
0.0 (0 rating)
Iklan

Pertanyaan serupa
RUANGGURU HQ
Jl. Dr. Saharjo No.161, Manggarai Selatan, Tebet, Kota Jakarta Selatan, Daerah Khusus Ibukota Jakarta 12860
Coba GRATIS Aplikasi Roboguru

Coba GRATIS Aplikasi Ruangguru


Produk Ruangguru
Bantuan & Panduan
Hubungi Kami

Ikuti Kami


©2026 Ruangguru. All Rights Reserved PT. Ruang Raya Indonesia