Iklan
Pertanyaan
Look at the line chart and the table, then choose the correct words to complete the paragraph! The line graph shows the visit to Australia by non-residents had overwhelmingly moved (a)_____over the period of 2 decades: it was nearly 10 million in 1975 and slightly more than 30 million in 2005. From the data on the table, we can infer that South Korea, Japan and Europe were leading sources of tourists to Australia. Other countries show(b)________. It is worth noticing that (c)_______ in the number of travelers to Australia was from Japan, South Korea and Europe The best answer to complete the paragraph is ....
Look at the line chart and the table, then choose the correct words to complete the paragraph!
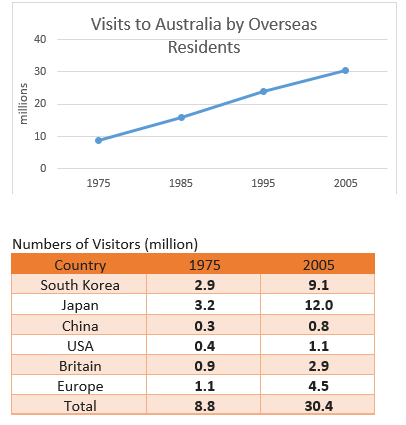
The line graph shows the visit to Australia by non-residents had overwhelmingly moved (a)_____over the period of 2 decades: it was nearly 10 million in 1975 and slightly more than 30 million in 2005. From the data on the table, we can infer that South Korea, Japan and Europe were leading sources of tourists to Australia. Other countries show (b)________. It is worth noticing that (c)_______ in the number of travelers to Australia was from Japan, South Korea and Europe
The best answer to complete the paragraph is ....
upward; dramatic increase; minor growth

upward; dramatic increase; the most significant growth
downward; dramatic increase; the most significant growth
upward; less dramatic increase; the most significant growth
upward; less dramatic increase; the least significant growth


Iklan
Y. Yuli.Widya
Master Teacher
Jawaban
jawaban yang benar adalah D.
Pembahasan
Arti kalimat pertama adalah "Grafik garis di atas menunjukkan bahwa kunjungan non-warga negara ke Australia terus bergerak ____ selama dua dekade." Perhatikan gambar di atas. Grafiknya selalu naik. Jadi, istilah yang dipakai untuk menggambarkan keadaan tersebut adalah upward (naik/meningkat). Sebelum bagian rumpang (b) dijelaskan “Dari data dalam tabel, kita dapat menyimpulkan bahwa Korea Selatan, Jepang dan Eropa adalah sumber turis utama ke Autralia.” Lalu, dilanjutkan kalimat “Negara-negara yang lainnya menunjukkan ...”. Dari kedua kalimat tersebut, kita mengetahui bahwa penulis membandingkan kenaikan jumlah pengunjung dari negara Korea Selatan, Jepang, dan Eropa dengan pengunjung dari negara-negara lainnya dalam daftar. Dari data pada tabel, kita dapat melihat bahwa kenaikan jumlah pengunjung dari negara-negara lain sangat sedikit dibandingkan dengan tiga negara tersebut. Jadi, jawaban yang tepat adalah less dramatic increase yangkenaikan yang kurang dramatis/ kenaikannya sedikit. Kalimat “It is worth noticing that (6)_______ in the number of travelers to Australia was from Japan, South Korea and Europe .” artinya “Sangat bagus (perlu) mengetahui bahwa ____dalam hal jumlah pengunjung adalah dari Jepang, Korea Selatan dan Eropa.” Sesuai dengan infomasi dalam tabel, maka kata yang tepat untuk melengkapi kalimat tersebut adalah the most significant growth yang artinya 'pertumbuhanyang paling signifikan'. Dengan demikian, jawaban yang benar adalah D.
Arti kalimat pertama adalah "Grafik garis di atas menunjukkan bahwa kunjungan non-warga negara ke Australia terus bergerak ____ selama dua dekade." Perhatikan gambar di atas. Grafiknya selalu naik. Jadi, istilah yang dipakai untuk menggambarkan keadaan tersebut adalah upward (naik/meningkat).
Sebelum bagian rumpang (b) dijelaskan “Dari data dalam tabel, kita dapat menyimpulkan bahwa Korea Selatan, Jepang dan Eropa adalah sumber turis utama ke Autralia.” Lalu, dilanjutkan kalimat “Negara-negara yang lainnya menunjukkan ...”. Dari kedua kalimat tersebut, kita mengetahui bahwa penulis membandingkan kenaikan jumlah pengunjung dari negara Korea Selatan, Jepang, dan Eropa dengan pengunjung dari negara-negara lainnya dalam daftar. Dari data pada tabel, kita dapat melihat bahwa kenaikan jumlah pengunjung dari negara-negara lain sangat sedikit dibandingkan dengan tiga negara tersebut. Jadi, jawaban yang tepat adalah less dramatic increase yang kenaikan yang kurang dramatis/ kenaikannya sedikit.
Kalimat “It is worth noticing that (6)_______ in the number of travelers to Australia was from Japan, South Korea and Europe.” artinya “Sangat bagus (perlu) mengetahui bahwa ____ dalam hal jumlah pengunjung adalah dari Jepang, Korea Selatan dan Eropa.”
Sesuai dengan infomasi dalam tabel, maka kata yang tepat untuk melengkapi kalimat tersebut adalah the most significant growth yang artinya 'pertumbuhan yang paling signifikan'.
Dengan demikian, jawaban yang benar adalah D.


Perdalam pemahamanmu bersama Master Teacher
di sesi Live Teaching, GRATIS!
3
5.0 (1 rating)
Iklan

Pertanyaan serupa
RUANGGURU HQ
Jl. Dr. Saharjo No.161, Manggarai Selatan, Tebet, Kota Jakarta Selatan, Daerah Khusus Ibukota Jakarta 12860
Coba GRATIS Aplikasi Roboguru

Coba GRATIS Aplikasi Ruangguru


Produk Ruangguru
Bantuan & Panduan
Hubungi Kami

Ikuti Kami


©2026 Ruangguru. All Rights Reserved PT. Ruang Raya Indonesia