Iklan
Pertanyaan
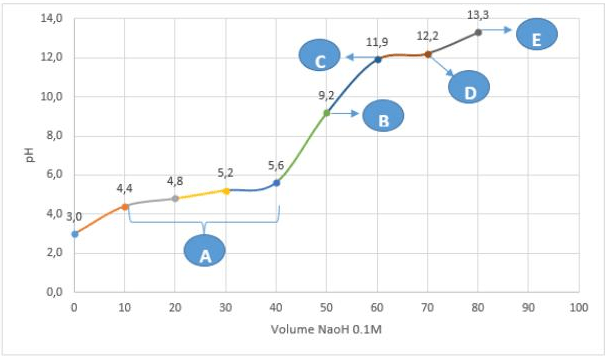
Grafik berikut ini menggambarkan pH campuran antara 50 mL larutan CH 3 COOH 0,1 M ( K a CH 3 COOH = 1 × 1 0 − 5 ) dengan sejumlah volume larutan NaOH 0,1 M Berdasarkan grafik, titik yang menggambarkan pH campuran hidrolisis garam adalah ....
Grafik berikut ini menggambarkan pH campuran antara 50 mL larutan 0,1 M dengan sejumlah volume larutan 0,1 M
 Berdasarkan grafik, titik yang menggambarkan pH campuran hidrolisis garam adalah ....


Iklan
S. Susanti
Master Teacher
Mahasiswa/Alumni Universitas Jayabaya
Jawaban
berdasarkan grafiktitik yang menggambarkan pH campuran hidrolisis garam adalah titik B.
Pembahasan
Larutan hidrolisis terbentuk ketika mol pereaksi asam dan basa habis semua. Sifat garam tergantung dari pereaksi yang kuat. Apabila50 mL larutan 0,1 M dicampurkan dengan sejumlah volume larutan 0,1 M dan terbentuk larutan hidrolisis, maka volume yang bereaksi yaitu : Pada grafik, jika ditarik garis lurus antara volume dan pH maka berpotongan di titik B. Pembuktian perhitungan pH nya yaitu : pH yang paling mendekati atau sesuai di grafik adalah pada titik B. Jadi, berdasarkan grafiktitik yang menggambarkan pH campuran hidrolisis garam adalah titik B.
Larutan hidrolisis terbentuk ketika mol pereaksi asam dan basa habis semua. Sifat garam tergantung dari pereaksi yang kuat.
Apabila 50 mL larutan  0,1 M
0,1 M  dicampurkan dengan sejumlah volume larutan
  0,1 M dan terbentuk larutan hidrolisis, maka volume yang bereaksi yaitu :

Pada grafik, jika ditarik garis lurus antara volume dan pH maka berpotongan di titik B. Pembuktian perhitungan pH nya yaitu :

pH yang paling mendekati atau sesuai di grafik adalah pada titik B.
Jadi, berdasarkan grafik titik yang menggambarkan pH campuran hidrolisis garam adalah titik B.


Perdalam pemahamanmu bersama Master Teacher
di sesi Live Teaching, GRATIS!
3
0.0 (0 rating)
Iklan

Pertanyaan serupa
RUANGGURU HQ
Jl. Dr. Saharjo No.161, Manggarai Selatan, Tebet, Kota Jakarta Selatan, Daerah Khusus Ibukota Jakarta 12860
Coba GRATIS Aplikasi Roboguru

Coba GRATIS Aplikasi Ruangguru


Produk Ruangguru
Bantuan & Panduan
Hubungi Kami

Ikuti Kami


©2026 Ruangguru. All Rights Reserved PT. Ruang Raya Indonesia