Iklan
Pertanyaan
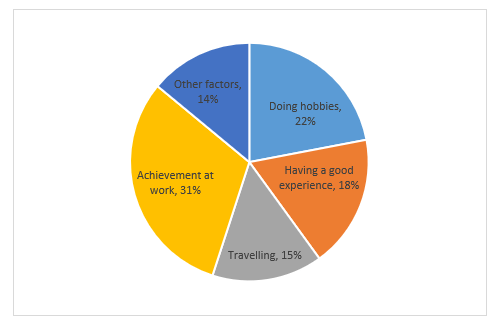
Look at the chart below to answer the question! What make people under 30 happy? The following sentences can be used to introduce the pie chart, EXCEPT …
Look at the chart below to answer the question!
What make people under 30 happy?
The following sentences can be used to introduce the pie chart, EXCEPT…
The pie chart shows various the reasons for people under 30 feeling happy. It’s noticeable that the factor of achievement at work takes the least share from the total data.

The pie chart illustrates the survey of a group of people under 30 about what makes them happy. It can clearly be seen that the largest percentage of what concerns them to be happy is achievement at work.
The chart shows an overview of a survey results regarding what makes people under 30 happy including various activities such as doing hobbies, traveling, and others.
The pie chart shows factors that cause people under 30 most happy. More than 30% of them agreed that achievement at work was the most effective factor making them happy.
The chart represents some different factors that bring happiness to a group of people under the age of 30.


Iklan
M. Robo
Master Teacher
Jawaban
penggunaan kata the least (paling sedikit) pada opsi A tidak tepat.
Pembahasan
Grafik tersebut mengilustrasikan alasan-alasan yang membuat orang berusia di bahwa 30 tahun merasa bahagia. Alasan yang paling umum adalah achievement at work yang mencapai angka 31%. Artinya, angka ini tertinggi dibandingkan yang lainnya. Jadi, penggunaan kata the least (paling sedikit) pada opsi A tidak tepat.
Grafik tersebut mengilustrasikan alasan-alasan yang membuat orang berusia di bahwa 30 tahun merasa bahagia. Alasan yang paling umum adalah achievement at work yang mencapai angka 31%. Artinya, angka ini tertinggi dibandingkan yang lainnya.
Jadi, penggunaan kata the least (paling sedikit) pada opsi A tidak tepat.


Perdalam pemahamanmu bersama Master Teacher
di sesi Live Teaching, GRATIS!
1
0.0 (0 rating)
Iklan

Pertanyaan serupa
RUANGGURU HQ
Jl. Dr. Saharjo No.161, Manggarai Selatan, Tebet, Kota Jakarta Selatan, Daerah Khusus Ibukota Jakarta 12860
Coba GRATIS Aplikasi Roboguru

Coba GRATIS Aplikasi Ruangguru


Produk Ruangguru
Bantuan & Panduan
Hubungi Kami

Ikuti Kami


©2026 Ruangguru. All Rights Reserved PT. Ruang Raya Indonesia