Iklan
Iklan
Pertanyaan
Look at the chart below and choose the correct words to complete the paragraph! The bar graph illustrates information about the number of passengers who used the three busiest airports in New York City over a period of five years from 1995 to 2000.Overall, it can be seen that the number of people using LaGuardia and Newark airports increased over the years whereas John F. Kennedy showed a fluctuating trend in the number of users. As for LaGuardia airport, it was the _____ airport throughout the period except in 1997, whereas John F. Kennedy was the ____ airport among the three in 1997. In 1995, around 35 million passengers used LaGuardia airport and this number ____ over the next years and reached 50 millions in 1999. The number of travelers using this airport hit 70 million in the year 2000.Similarly, the number of travelers using Newark rose from 15 million in 1995 to just above 40 million in 2000.The number of travelers using John F Kennedy airport was the highest in 1997 (48 million) and 2000 (42 million). This airport was also the second busiest airport in the years 1995, 96 and 2000.
Look at the chart below and choose the correct words to complete the paragraph!
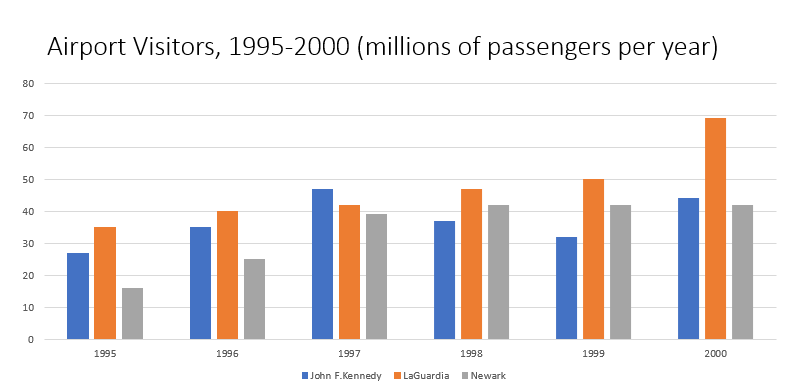
The bar graph illustrates information about the number of passengers who used the three busiest airports in New York City over a period of five years from 1995 to 2000. Overall, it can be seen that the number of people using LaGuardia and Newark airports increased over the years whereas John F. Kennedy showed a fluctuating trend in the number of users.
As for LaGuardia airport, it was the _____ airport throughout the period except in 1997, whereas John F. Kennedy was the ____ airport among the three in 1997. In 1995, around 35 million passengers used LaGuardia airport and this number ____ over the next years and reached 50 millions in 1999. The number of travelers using this airport hit 70 million in the year 2000. Similarly, the number of travelers using Newark rose from 15 million in 1995 to just above 40 million in 2000. The number of travelers using John F Kennedy airport was the highest in 1997 (48 million) and 2000 (42 million). This airport was also the second busiest airport in the years 1995, 96 and 2000.
busiest; most popular; sharply fell

most popular; busiest; gradually rose
least popular; busiest; gradually rose
most popular; busiest; significantly rose
busiest; most popular; significantly rose

Iklan
Y. Yuli.Widya
Master Teacher
Jawaban
jawaban yang tepat adalah B.
Iklan
Pembahasan
LaGuardia adalah bandara yang paling banyak pengunjungnya hampir setiap tahun pada periode tersebut kecuali tahun 1997, karena pada tahun tersebut, bandara yang paling banyak pengunjungnya adalah John F, Kennedy. Paling pengunjung berarti bandaranya paling populer ( most popular ) atau boleh juga dikatakan paling sibuk ( busiest ) karena banyak pengunjung yang harus dilayani. Lalu, jumlah pengunjung bandara LaGuardia tahun 1995 adalah 35 juta, dan angka ini meningkat perlahan ( gradually increased ) setiap tahunnya. Perhatikan batang grafik berwarna oranye. Grafiknya menunjukkan peningkatan perlahan, bukan signifikan. Jadi, jawaban yang tepat adalah B.
LaGuardia adalah bandara yang paling banyak pengunjungnya hampir setiap tahun pada periode tersebut kecuali tahun 1997, karena pada tahun tersebut, bandara yang paling banyak pengunjungnya adalah John F, Kennedy. Paling pengunjung berarti bandaranya paling populer (most popular) atau boleh juga dikatakan paling sibuk (busiest) karena banyak pengunjung yang harus dilayani.
Lalu, jumlah pengunjung bandara LaGuardia tahun 1995 adalah 35 juta, dan angka ini meningkat perlahan (gradually increased) setiap tahunnya. Perhatikan batang grafik berwarna oranye. Grafiknya menunjukkan peningkatan perlahan, bukan signifikan.
Jadi, jawaban yang tepat adalah B.


Perdalam pemahamanmu bersama Master Teacher
di sesi Live Teaching, GRATIS!
2
0.0 (0 rating)
Iklan
Iklan

Pertanyaan serupa
RUANGGURU HQ
Jl. Dr. Saharjo No.161, Manggarai Selatan, Tebet, Kota Jakarta Selatan, Daerah Khusus Ibukota Jakarta 12860
Coba GRATIS Aplikasi Roboguru

Coba GRATIS Aplikasi Ruangguru


Produk Ruangguru
Bantuan & Panduan
Hubungi Kami

Ikuti Kami


©2024 Ruangguru. All Rights Reserved PT. Ruang Raya Indonesia