Iklan
Pertanyaan
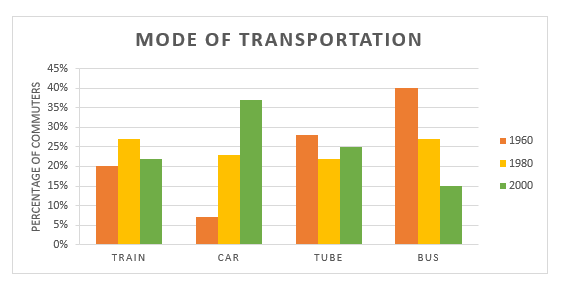
Look at the chart and answer the question ! Which of the following statements are CONTRARYto the data provided in the chart?
Look at the chart and answer the question!
Which of the following statements are CONTRARY to the data provided in the chart?
Four transportation type- train, car, tube and bus - are compared in the chart and it shows that in this European city people used buses in early years but started preferring cars and tubes in later years to reach and return from their workplaces.

In 2000, more than one-third of these Europeans started using cars while only 15% of them used buses to travel to and from their workplaces. Tubes retained almost one-fourth of the commuters while train usage stood just above 20%.
Around four out of ten of these Europeans used buses to reach their offices and to get back homes in 1960. Tubes were the second most preferred mode of transportation as around 28% people took this form of vehicle.
Initially, in 1960, around 20% people used trains, 7% people used cars, 28% people used tubes and around 40% people used buses to go to work or to return from work. After 20 years, the popularity of train and car decreased while the popularity of tube and bus increased.
There was a tremendous rise in the usage of cars for travelling to and from the office from 1960 to 2000.


Iklan
K. Dillan
Master Teacher
Pembahasan
Perhatikan batangwarna oranye (1960). Grafik tertinggi adalah bus. Namun, 20 puluh tahun setelahnya (1980: batangwarna kuning), persentase pengguna bus turun, yang sebelumnya sekitar 40% menjadi sekitar 27%. Jadi,pernyataan A benar. Pada tahun 2000 (batangwarna hijau), sekitar 37 persen atau lebih dari sepertiga orang lebih memilih menggunakan alat transportasi mobil, sedangkan pengguna bus hanya 15%. Sekitar 25 % atau seperempat pengguna menggunakan tubes, sementara pengguna kereta api sekitar 22%. Oleh karena itu, pernyataan B benar. Sekitar 40 % atau 4 dari 10 orang menggunakan bus di tahun 1960. Jenis kendaran yang lebih disukai pada urutan kedua adalah tubes . Penggunanya sekitar 28%. Pernyataan C benar. Perhatikan batang berwarna hijau pada car . Itu menunjukkan bahwa pada tahun 2000, pengguna mobil ada sekitar 37 %. Artinya, pengguna mobil terus meningkat. Pernyataan E benar. Perhatikan batangberwarna oranye dan kuning (tahun 1960 dan tahun 1980). Pengguna kereta api ( train ) meningkat, sedangkan pengguna tubes dan bus berkurang. Jadi, pernyatan yang tidak tepat adalah D. Kalimat “the popularity of train and car decreased while the popularity of tube and bus increased .” seharusnya diganti menjadi “the popularity of train and car increased while the popularity of tube and bus decreased .”
Perhatikan batang warna oranye (1960). Grafik tertinggi adalah bus. Namun, 20 puluh tahun setelahnya (1980: batang warna kuning), persentase pengguna bus turun, yang sebelumnya sekitar 40% menjadi sekitar 27%. Jadi, pernyataan A benar.
Pada tahun 2000 (batang warna hijau), sekitar 37 persen atau lebih dari sepertiga orang lebih memilih menggunakan alat transportasi mobil, sedangkan pengguna bus hanya 15%. Sekitar 25 % atau seperempat pengguna menggunakan tubes, sementara pengguna kereta api sekitar 22%. Oleh karena itu, pernyataan B benar.
Sekitar 40 % atau 4 dari 10 orang menggunakan bus di tahun 1960. Jenis kendaran yang lebih disukai pada urutan kedua adalah tubes. Penggunanya sekitar 28%. Pernyataan C benar.
Perhatikan batang berwarna hijau pada car. Itu menunjukkan bahwa pada tahun 2000, pengguna mobil ada sekitar 37 %. Artinya, pengguna mobil terus meningkat. Pernyataan E benar.
Perhatikan batang berwarna oranye dan kuning (tahun 1960 dan tahun 1980). Pengguna kereta api (train) meningkat, sedangkan pengguna tubes dan bus berkurang.
Jadi, pernyatan yang tidak tepat adalah D.
Kalimat “the popularity of train and car decreased while the popularity of tube and bus increased.” seharusnya diganti menjadi “the popularity of train and car increased while the popularity of tube and bus decreased.”


Perdalam pemahamanmu bersama Master Teacher
di sesi Live Teaching, GRATIS!
1
5.0 (1 rating)
Iklan

Pertanyaan serupa
RUANGGURU HQ
Jl. Dr. Saharjo No.161, Manggarai Selatan, Tebet, Kota Jakarta Selatan, Daerah Khusus Ibukota Jakarta 12860
Coba GRATIS Aplikasi Roboguru

Coba GRATIS Aplikasi Ruangguru


Produk Ruangguru
Bantuan & Panduan
Hubungi Kami

Ikuti Kami


©2026 Ruangguru. All Rights Reserved PT. Ruang Raya Indonesia