Iklan
Pertanyaan
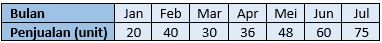
Diagram batang berikut menunjukkan penjualan sepeda motor sebuah dealer selama 7 bulan. Pada bulan apakah terjadi kenaikan penjualan Sepeda motor sebesar 20%?
Diagram batang berikut menunjukkan penjualan sepeda motor sebuah dealer selama 7 bulan.
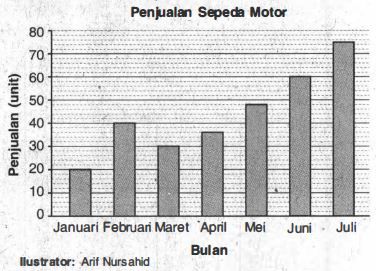
Pada bulan apakah terjadi kenaikan penjualan Sepeda motor sebesar 20%?
Maret-April

April-Mei
Mei-Juni
Juni-Juli


Iklan
I. Ridha
Master Teacher
Mahasiswa/Alumni Universitas Negeri Surabaya
Jawaban
jawaban yang tepat adalah A.
Pembahasan
Data penjualan motor dapat dibuat menjadi tabel seperti berikut, Jadi,jawaban yang tepat adalah A.
Data penjualan motor dapat dibuat menjadi tabel seperti berikut,


Jadi, jawaban yang tepat adalah A.


Perdalam pemahamanmu bersama Master Teacher
di sesi Live Teaching, GRATIS!
5
5.0 (5 rating)
Iklan

Pertanyaan serupa
RUANGGURU HQ
Jl. Dr. Saharjo No.161, Manggarai Selatan, Tebet, Kota Jakarta Selatan, Daerah Khusus Ibukota Jakarta 12860
Coba GRATIS Aplikasi Roboguru

Coba GRATIS Aplikasi Ruangguru


Produk Ruangguru
Bantuan & Panduan
Hubungi Kami

Ikuti Kami


©2026 Ruangguru. All Rights Reserved PT. Ruang Raya Indonesia